
How bad metrics are hurting your business and your users’ experience
June 2, 2021
The other day one of our teammates shared that when he took his car for scheduled maintenance, they asked him to rate them 5 starts because they were a “5 star” establishment. This ended up being one of the premises for writing this article.
Let’s assume your customers actually let themselves be manipulated by this kind of insinuations and end up rating your service 5*. What kind of feedback are you really getting? Is it useful in any away? If you don’t want your customers to provide their honest feedback then you’re not actually interested in knowing if you’re providing a great customer experience and if you can improve it in any way.
Not to mention that skewing your customers towards the answer you want to hear will give them a pretty negative impression of your business.
“The system of false metrics doesn’t create a better buying experience, it creates a threatened customer with pressure to give a five.”
Seth Godin in “Avoiding false metrics"
If you aim for a 5-star rating work towards that. Ask your users the right questions in order to get their honest feedback. If they tell you you’re not doing so great in certain aspects, work to make things different in order to improve their experience with your service.
Businesses are deceiving themselves and annoying their customers as a consequence. They do so when they apply biased surveys only expecting to confirm what they want to hear. The truth is surveys can be a valuable source of information from our users, but only if they are used correctly. Poorly executed surveys can become a bogus guiding-light and lead to vanity metrics that will provide no actionable insights.
Running ineffective surveys

A cashier giving the customer the receipt and pointing out how they can get a discount on a future purchase if they just take a moment to go online and fill out a survey. An email sent shortly after someone buys something on a e-commerce website asking for their feedback. Intrusive pop-up windows while people are still starting to browse a website. Not to mention those smiley survey terminals that ask customers to rate the service as they exit a store — What does a sad face actually mean? Did the cashier wink inappropriately? Was it expensive? Was it dirty? You’ll never know.
Surveys are quite a flexible user-research tool. They allow business to gather information about their users, their attitudes and behaviours. It’s a fairly cheap and fast method, they’re easy to create in one of the several online platforms available and to distribute (in-person, by phone or online). However, a survey will only generate quality data if it contains relevant questions, aligned with the research goal. Sadly, most of the times that’s not the case. Very often businesses fail to apply effective surveys.
As consumers we’ve witnessed that. Who hasn’t come across a survey with confusing or misleading questions? Who hasn’t been annoyed by taking that never-ending survey? There’s even a Twitter profile where people share some examples of bad survey questions (some pretty hilarious we must say).
Taking a closer look at some examples will help us understand how businesses are making it wrong.
Asking leading questions
This type of questions lead your respondents to answer a specific manner, based on the way they are framed. To identify a leading question look for subjective adjectives or context-laden words.
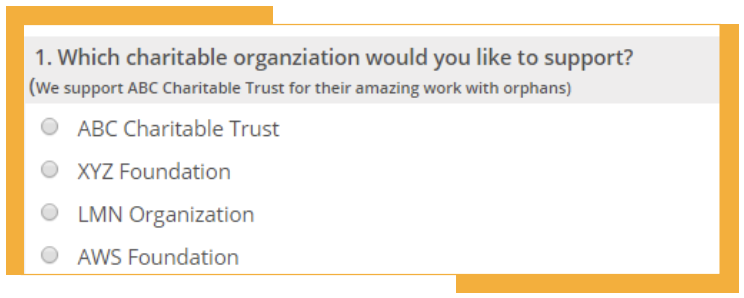
Source: SoGoSurvey website
In the example above, the information included between brackets is clearly trying to sway people to go for one specific organisation, highlighting their “amazing work with orphans”.
If you ask “How great is our hard-working customer support team?” you’re implying that the customer support team is “great” and “hard-working”. To make it a non-leading question you would have to rephrase it “How would you describe your experience with the customer support team?”
A good survey question must not contain any judgement or insinuations but rather be objective and concrete.
Mismatched scales and poor answer options
The answer options you provide are just as important as the questions you ask. If scales are confusing or unbalanced, you’ll not be able to rely on the survey results.
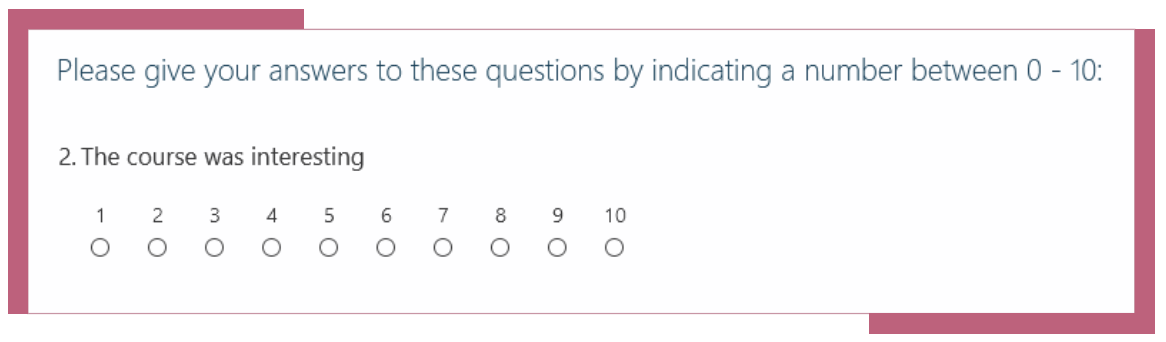
Source: Bad Survey Question
Let’s take this example. Apparently we’re supposed to answer the questions by indicating a number between 0–10. But what does 0 stands for? And 10? This makes it quite difficult to provide an accurate answer. We’re sure this wasn’t exactly what Rensis Likert had in mind when he created the Likert Scale. In this five- or seven-point rating system respondents are supposed to choose from a range of possible responses to a specific question or statement. These responses normally are “Strongly agree”, “Agree”, “Neutral”, “Disagree” and “Strongly disagree”.
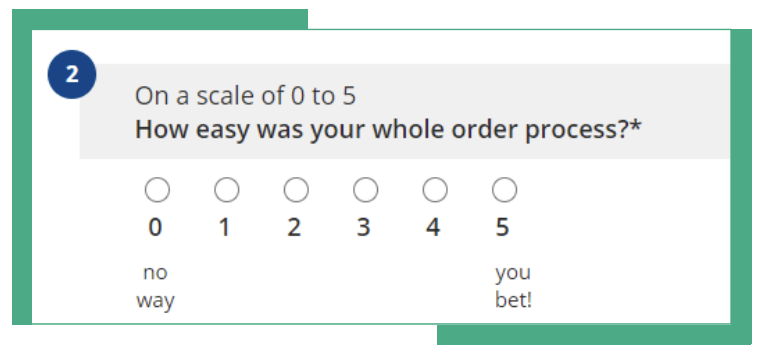
Source: Bad Survey Question
In this example, they explain what 0 and 5 stand for. Great, right? Well, it could be if the answers “No way” and “You bet!” were actually a fitted answer to the question. “Extremely difficult” for 0 and “Extremely easy” for 5 would be better to evaluate the ease of the order process.
We could have also mentioned this above as an example of a leading question. When they ask “How easy was your whole order process?” they’re implying their service is easy. Instead you could ask, “How would you describe your order process?” and provide a range of suitable options to choose from.
When writing answer options, you should first consider the best way to ask a question and then think about the response types that will allows respondents to give a sincere and accurate feedback.
Painfully long surveys
A Survey Monkey study showed that the more questions per survey, the higher the respondent drop-off rate from start to finish. If a person begins answering a survey, there’s a sharp increase in drop-off rate occurring with each additional question up to 15 questions.
To save time it might be tempting to add more areas for exploration when writing surveys. Areas sometimes completely distinct from one another. The problem is they become excessively long. Surveys should be kept short in order to optimise the response rate. They should begin with easier questions, leaving the harder ones to the end as they are more likely to demotivate participants and eventually make them abandon it.
Overloading your questions
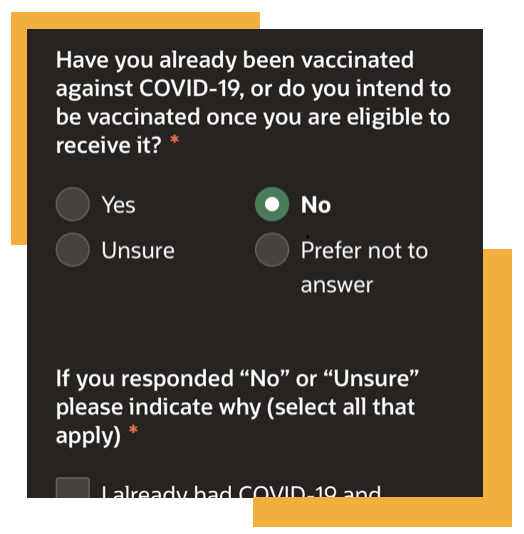
Source: Bad Survey Question
In this example, the question is requesting two different answers at the same time — “Have you already been vaccinated against COVID-19?” and “Do you intend to be vaccinated once you are eligible to receive it?” The answer to the first might be “No” and to the second one “Yes”, or vice-versa.
Then there’s the answer options. “Unsure” shouldn’t be an option to the first question because you either have or haven’t been vaccinated (unless you were sedated and can’t remember, which is highly unlikely 😅).
Each question should convey a single idea. In double-barrelled questions the respondent can end up providing an answer to none of the questions or focus on the question that appeals more to them and ignore the other. The responses to these questions are not useful for analysis because they don’t reveal the true point of view of the respondent.
Pushing your users into survey fatigue

A customer’s despair
Over the past decade, as businesses began taking a user-centric approach, we’ve witness an increase in the number of surveys they send out to get feedback from their audience.
We’ve all been asked to provide our feedback on a product or service several times, in different ways. But how many times did we ignore that “Please, can you give us your feedback” email, close that pop-up window asking us to rate their service or say we were too busy and couldn’t answer a phone survey?
Users have become bored, tired or uninterested in companies’ surveys due to the overwhelming number of requests for feedback they get almost every day. If they decide not to take the survey, response rates start dropping and businesses don’t get the insights they’re looking for.
That’s why you need to consider how often to send out surveys or you risk spending time and money running surveys that will be filled out carelessly or worst, never answered.
When a lot of important decisions are made based on surveys then we clearly have a problem. Bad survey questions lead to bad data and derail business decisions.
Surveys are a waste of time and money if users are not at the centre of the process and if they’re not kept in mind when writing survey questions.
Crafting a survey with unbiased questions, keeping it short and simple, using clear language and a good structure will help you collect valuable information from your users. Surveys can be a useful tool to provide input for the design process and improve users’ experience with your product or service.
You’re not measuring what matters
Going back to that car maintenance experience a teammate shared. Those employees were clearly worried about getting a 5-star rating. Being able to say “90% of clients say we provide a 5-star service” makes you feel good but tells you nothing about your business. That takes us two the next topic we want to focus on — vanity metrics.
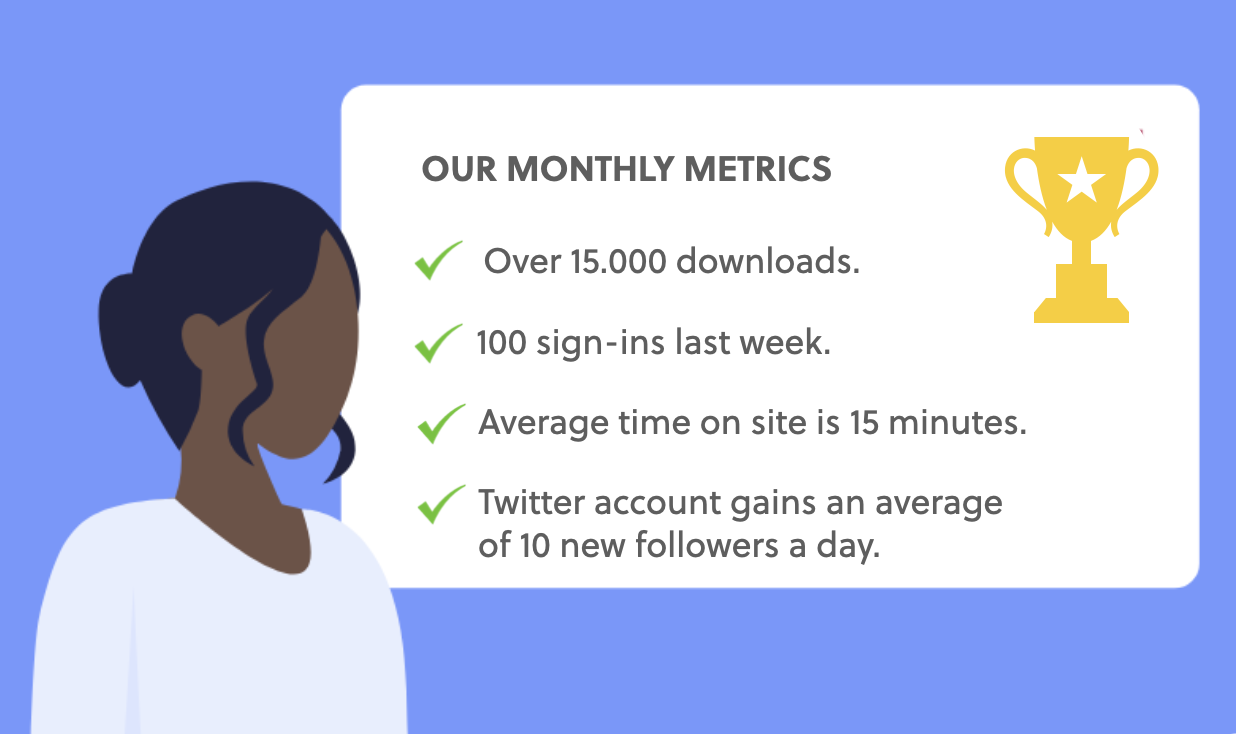
Examples of vanity metrics
Presenting these numbers at a meeting will certainly make you and your boss feel good. But does any of these numbers help us understand if our product is working for our users?
You might be gaining 10 new Twitter followers a day but what if you’re also losing an average of 15 followers every day? If we only look at the metric that makes us feel good we simple assume that everything is going well. Now, if we take a look behind the curtain we might come to the conclusion that some work needs to be done in order to retain our audience.
Your app may have been downloaded hundreds of times but how many users are actually active users, engaging with your app? Downloads are great but they turn out useless if engagement and retention rates immediately decline.
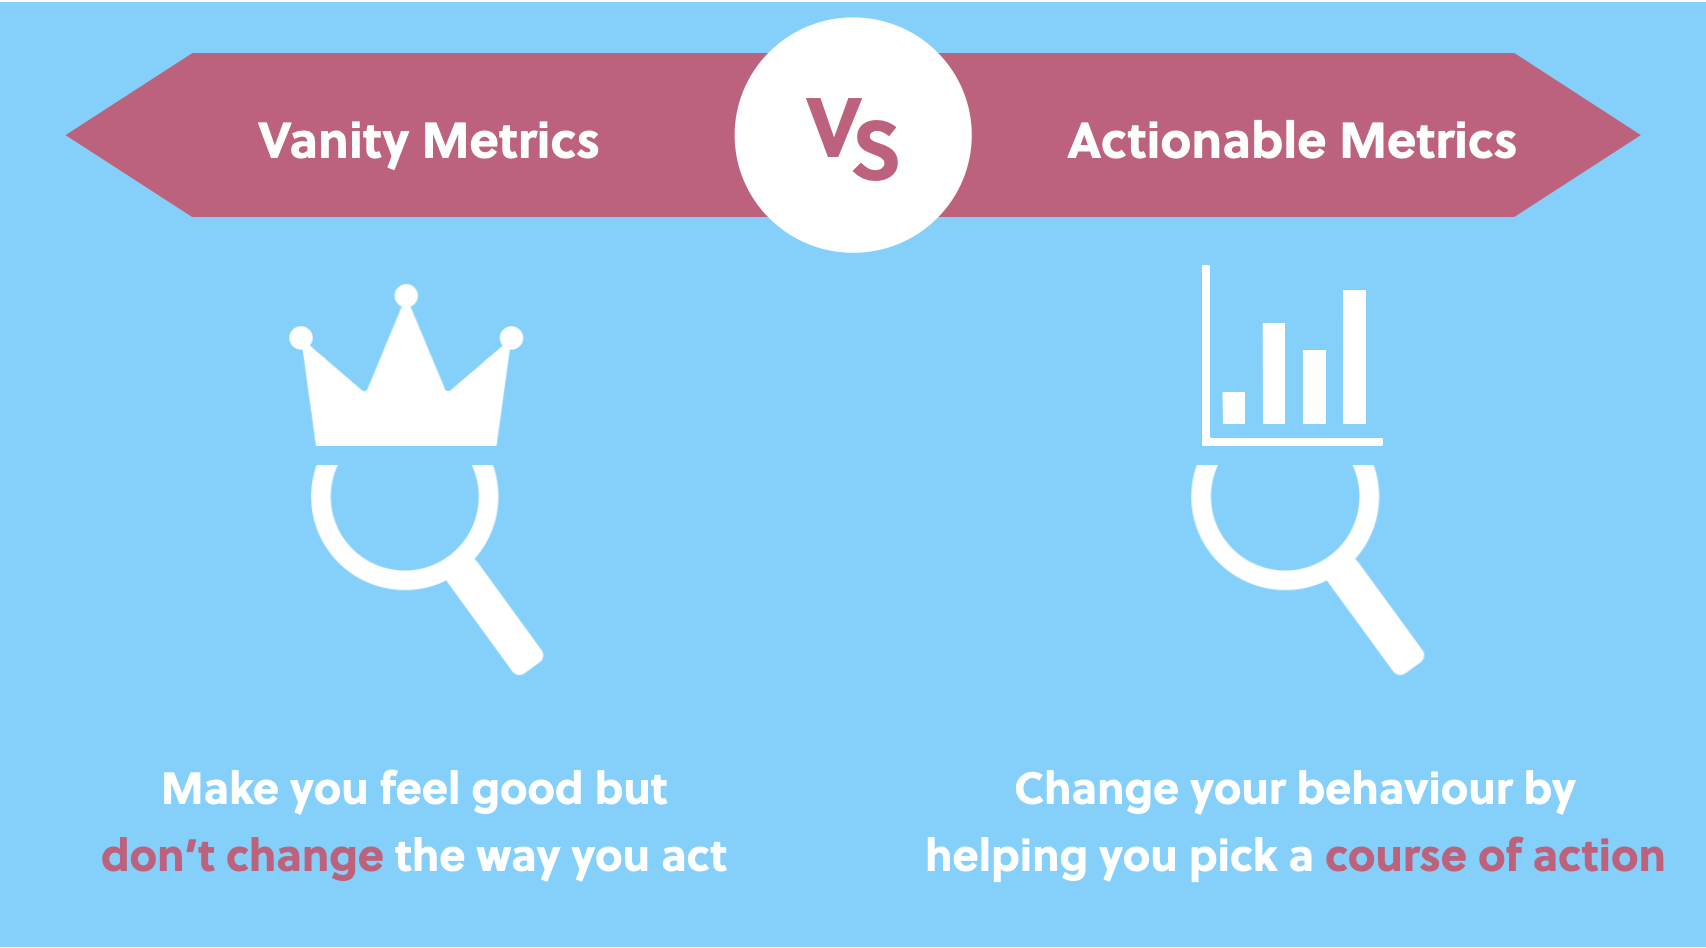
Traffic, page views, new social media followers, time on site, number of downloads — these are only a few examples of vanity metrics. They don’t provide any actionable steps to improve your business strategy. They have no real business value.
“If you have a piece of data on which you cannot act, it’s a vanity metric. If all it does is stroke your ego, it won’t help. You want your data to inform, to guide, to improve your business model, to help you decide on a course of action.”
Alistair Croll & Benjamin Yoskovitz in Lean Analytics
Turning vanity metrics into actionable metrics
Unlike vanity metrics, actionable metrics provide deep insights to help drive business changes.
Let’s say you had 10.000 new visitors to your website last week. Sounds pretty great, right? What if they bounce from your page within the first 5 seconds? Finding out the reasons for this to happen can help you make the necessary adjustments to solve the issue.
What makes a good metric?
In Lean Analytics, Alistair Croll and Benjamin Yoskovitz say a good metric…
… is comparative — Comparing a metric to other time periods, groups of users or competitors helps understand the ways things are rolling. Ex: Increased conversion by 10% from last week.
… is understandable — People should be able to remember it and discuss it so that a change in the data can turn into a change in the culture.
… is a ratio or a rate — If you compare a daily metric to the same metric over a month, you’ll see whether you’re looking at a sudden spike or a long-term trend. Ratios are good to make comparisons and they make it easier to understand the “health” of a company. As a result, they are easier to act on, helping you understand if you’re heading towards your business goals or the opposite way.
… changes the way you behave — What will you do differently based on changes in the metric? What will you do if more than half of respondents say they won’t pay for a certain feature? You won’t develop it. A good metric must be aligned with your business goals, be it keeping users, acquire new customers or generate more sales.
Net Promoter Score — why you shouldn’t trust this metric
We’re pretty sure that as a customer you’ve been asked this question at some point:
On a scale from 0 to 10, how likely are you to recommend [COMPANY] to a friend or colleague?
This question was first introduced back in 2003 by the marketing consultant Fred Reichheld in an Harvard Business Review article, believing that this single question could assess an organisation’s customer’s loyalty and business growth. Since then, the Net Promoter Score (NPS) as been used by countless companies worldwide.
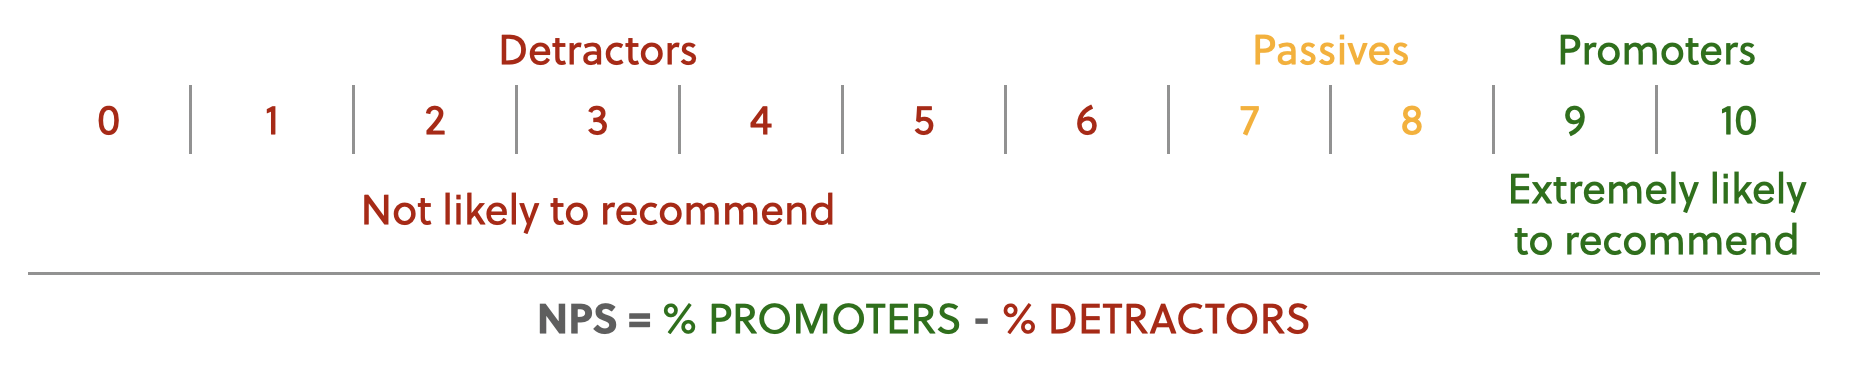
Depending on how they answer, customers are categorised into three groups — promoters (scores 9 and 10), passives (scores 7 and 8) and detractors (scores 0 to 6). NPS is then calculated by subtracting the percentage of customers who answered with a 6 or lower from the percentage of customers who answered with a 9 or 10. The score is negative when a company has more detractors than promoters, and positive if it’s the other way around.
However, this isn’t a metric you should rely on. If a customer scores a 7 how will you know the reasons behind it? At what point of their experience where they dissatisfied? And if you don’t know the reasons, how will you know what you can do to improve their experience?
In the article “Net Promoter Score Considered Harmful (and What UX Professionals Can Do About It)”, Jared Spool carefully explains the flaws of this metric. He points out:
The best research questions are about past behavior, not future behavior. Asking a study participant “Will you try to live a healthy lifestyle?” or “Are you going to give up sugar?” or “Will you purchase this product?” requires they predict their future behavior. We are more interested in what they’ve done than what they’ll do. We’re interested in actual behavior, not a prediction of behavior.
Why you should be measuring the user experience
Any analytics tool will easily inform you about your website’s page views. However, page views tell you little about the experience people are having while navigating the website.
Time on site is normally associated with engagement. People spending more time on your site might be a good thing, but also a bad thing if they’re spending that time felling confused or frustrated because they’re not finding what they’re looking for.
In an article for UXMatters, Pamela Pavliscak wrote “Most metrics are marketing oriented, not experience oriented.” UX metrics provide insights that allow to measure the usability of a website or an app, revealing areas that can be improved.
Improving your business with effective surveys and more meaningful metrics
“Unless we measure what effect our changes have on our product or company, we can never truly know that what we are doing is making things better.”
Laura Klein in Build Better Products

Bad surveys will lead to unreliable feedback. You’ll miss the opportunity to understand the users’ experience and the chance to improve it. Having a clear idea of what your research objectives are is the first step towards an effective survey. In Just Enough Research, Erika Hall says “You need to ensure that you ask the right number of questions, that they are possible to answer, and that you have already decided a clear path from survey results to action.”
Ineffective surveys can lead to meaningless metrics that don’t solve problems. The same happens with other countless metrics provided by analytics tools often tracked by businesses.
Identifying the right metrics and accessing the necessary data will get you valuable insights. Meaningful metrics help you understand what’s going on with your product, how users are experiencing it and offer insights to improve it.
Both well-crafted surveys and meaningful metrics can provide actionable insights and help you make better, well-informed decisions, that will improve your users experience with your digital product.
Learn from the experts
Want to know more about writing better surveys and applying metrics that matter the most to your business? We recommend taking a look at these authors:
- Just Enough Research by Erika Hall
- User Research: A Practical Guide to Designing Better Products and Services by Stephanie Marsh
- Surveys That Work: A Practical Guide for Designing Better Surveys by Caroline Jarrett (to be published in 2021)
- Lean Analytics by Allistair Croll and Benjamin Yoskovitz
- UX for Lean Startups by Laura Klein
- Measuring the User Experience, William Albert and Thomas Tallis
- Build Better Products by Laura Klein
- Practical Metrics for Designers by Kate Rutter (to be published in 2021)
Need some help improving your business?
At Xperienz we can help you collect useful data from your user base by applying effective surveys. We can also assist you in the definition and assessment of the right metrics that will inform better design and business decisions.
Tell me moreRelated Articles
-
A glimpse into the future — Here’s the UX design trends we expect to dominate 2024
Emerging technologies and tools constantly influence the way people use the Internet and interact with digital products. And as user behaviours and preferences evolve, designers must keep up with new tools and solutions to deliver interfaces and user experiences that cater the needs of an ever-demanding audience.
-
Design for a better world - How working together and applying design approaches is improving people's lives
9 November is World Usability Day 2023. This year's theme is Collaboration and Cooperation, which intents to focus on how we can work together to create solutions, both globally and locally, to solve the world's biggest problems.
-
Be an Agent of Change - Check these resources to help you build more ethical designs
The role of today's designer goes far beyond simply creating beautiful interfaces and experiences. You can no longer design without considering the consequences of how what you're creating impacts individuals, society and the world.
-
E-commerce and Accessibility - Creating an inclusive online shopping experience
Now it’s the time for online stores to improve their website accessibility and ensure they offer an inclusive experience for everyone.
-
The future is today — How can we leverage AI to improve our UX Design work
AI has now become a big part of several areas of our lives, and UX Design is no exception. It’s actually becoming more and more applicable to the UX design process.
-
Conducting usability testing with people with disabilities
Drawing on our experience conducting usability tests with users with disabilities, we’re sharing a few things to take into account when planning and conducting research with people with disabilities and make sure everything goes smoothly and you can collect valuable insights.
-
Accessibility Compliance App - by Xperienz. A useful tool when fixing accessibility errors
To simplify the presentation of the accessibility evaluation of websites, Xperienz has created the Accessibility Compliance App. We start by doing a content inventory in which we collect all the pages of the site. Then we evaluate each page and list all the aspects that need to be fixed.
-
What does the UX future hold? - Here's the UX Design trends we expect to dominate 2023
Businesses must stay up to date on emerging user experience and interface trends so we've selected 7 top trends that are already making, and will certainly continue to make, an impact on website and app development.
-
Raising Awareness for Web Accessibility [Infographic] — International Day of Persons with Disabilities
Last December 3 we celebrated the International Day of Persons with Disabilities. To help promote a more accessible Web we’ve put together an easy-to-digest infographic about Web Accessibility.
-
Why hiring external UX services even when you have an in-house UX team?
Even if you have an in-house UX design team, there might be times when additional resources and professional know-how can be useful. Bringing in an external UX team might be exactly what you need for your company to excel in all projects.
-
Health and UX: when design has a life-saving potential
A good experience with healthcare technology and services, that is both useful, accessible and reliable, can make a huge different in improving peoples’ well-being, as well as the work of healthcare professionals.
-
Trust — Breaking or Building it Through Design
Trust is more valuable now than ever. 68% say trusting a brand they buy or use is more important today than in the past (Edelman, 2019). We live in an ever-growing digitalised world, where we increasingly interact and transact online. At the same time we constantly crave for trust-based interactions in digital environments. Questions like "Will the personal data I provide here be misused?", " Will my email be used to spam me incessantly?" or "Do I really want to share my bank details to a website I've never heard about?" have certainly come to our mind more than once.
-
Creating accessible digital experiences
Accessibility is of major importance for organisations who deliver web products and tools. Accessibility issues can affect not only a website’s usability for people who have disabilities but also for those who don’t. By offering accessible products, organisations will show they are inclusive, reach a wider market, be legally compliant, and offer a better user experience. For everyone.
-
"You're on Mute" - Lessons Learned After a Year of Conducting Remote User Research
After more than one year of engaging with users remotely, we want to reflect on the pitfalls of remote user research, share some of the lessons we learned and reflect on what’s going to be “the next normal” after Covid’s impact.
-
Quick & Dirty User Research
Tight timescales and budgets are no excuses to ditch user research altogether, specially when we all know it’s essential to make sure you deliver easy-to-use products. Quick and dirty research is a great way to get user insights fast and on a budget.
-
How bad metrics are hurting your business and your users’ experience
Businesses are deceiving themselves and annoying their customers as a consequence. They do so when they apply biased surveys only expecting to confirm what they want to hear.
-
UX Writing — Create better experiences with better content
Imagine a website or an app with no words. If it wasn’t for the logo, would you be able tell what this page is about? Would you know which button to click? Where navigation would take you? What you’re supposed to write in the search bar? No matter how good-looking an interface is, without words users will simply not be able to accomplish any tasks in it.
-
10 Bad User Research Practices You Will Want to Avoid
Some might think user research is as simple as watching people perform a few tasks on a website or asking them a few questions, but user research is definitely not walk in the park. Let’s go through some of the mistakes that can arise when planning and conducting research.
-
UXLx Masters — Wrap-up
From 10 to 13 February attendees from 25 countries and 14 world-renowned UX experts joined online for 3 days of learning. The programme included 12 live masterclasses, 2 keynotes, 2 live podcasts, and more.
-
Remote UX Research — our selection of the best online tools to conduct it
As a company that focus on UX research and design, we gathered some of the best tools to conduct remote research and combined them, with our personal knowledge, in this article.
-
Health Habits during the Lockdown
Xperienz, along with 15 other agencies from the global network of user research companies UX Fellows, conducted an intercultural study in 15 different countries about health and wellbeing during the lockdown caused by the current pandemic situation.